Revenue Detail
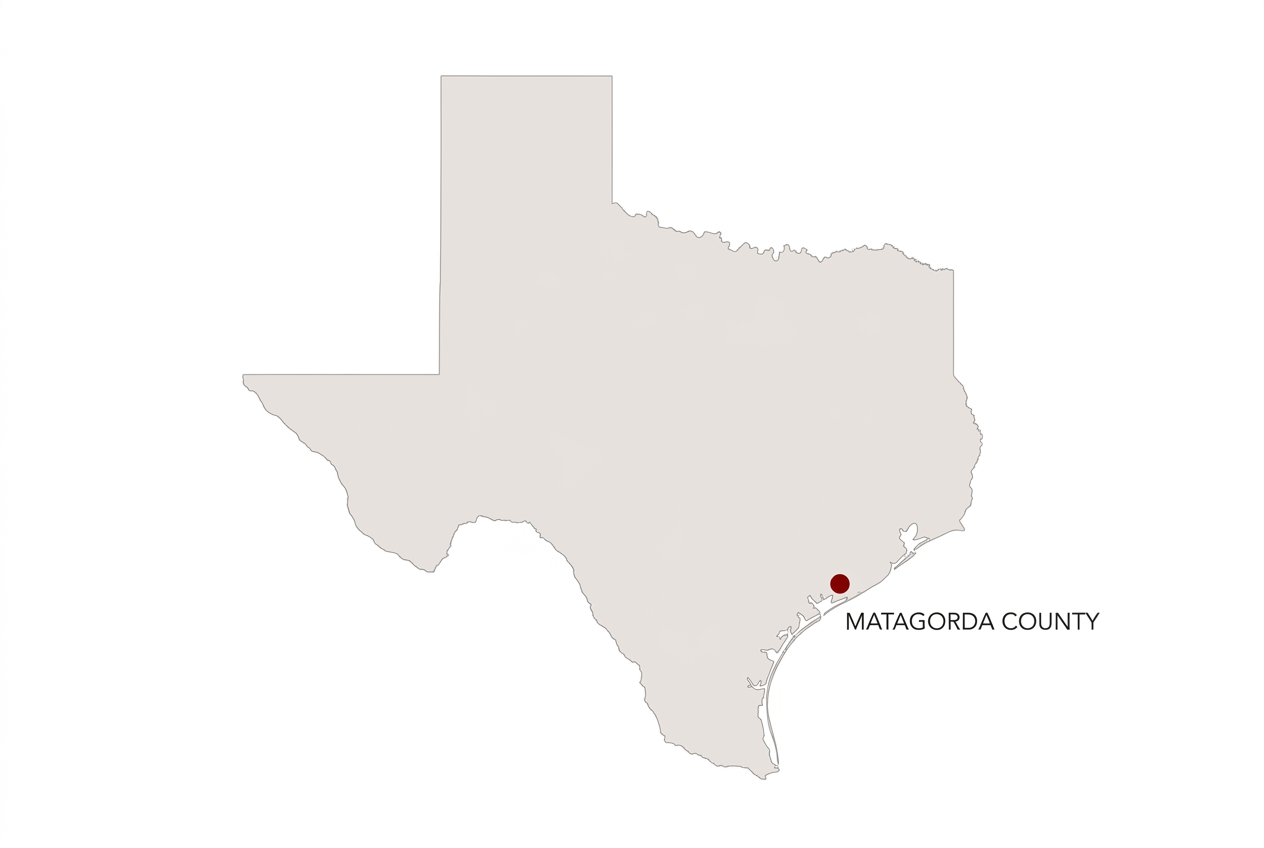
Industrial Bravo Project
Matagorda County, Texas
- Annual MWh and revenue
- Contracted and merchant pricing by scenario.
MW DC93.1
MW AC51.6
CODOct 10
Revenue Summary
Plant nameplate (POIN)50.0 MW
Year-1 production-
Year-35 production-
Implied annual degradation-
Active scenario-
P50 revenue (Y1-35)-
P50 contracted revenue (Y1-20)-
P50 tail revenue (Y21-35)-
P90 revenue (Y1-35)-
Revenue Chart
P50 RevenueP90 RevenueContracted MWhTail MWh
Annual Schedule
| Yr | MWh | Model AC Deg. | Module DC Deg. | $ / MWh | P50 Rev | P90 Rev |
|---|
Deg basis: Model AC = IE Partner PVSyst AC curve, calculated YoY from MWh; Module DC = IE Report module max annual degradation 0.45%. PVSyst LID is one-time degradation: Erthos 2.5%, Partner 2.0%.